RalphTrimble
TVWBB Diamond Member
Watching the development log I see you have been doing lots of work on the Heater Meter lately, so I thought perhaps this is a good time to put a wish list out there...
You've covered lots of bases already, lowering the noise level and adding the filters to the probe line(s) should be a nice improvement, and the integration of thermocouple support is awesome as well. The addition of the servo booster circuit is great, my servo has been working really nice and solid since I put the prototype circuit inline.
One thing I would like to see change, on the graph I think it would be better to have the temperatures listed on the right and the blower speed listed on the left. We had discussed this before and most people agreed, it would be more functional to have the temperature scale on the right where the probe graphs terminate.
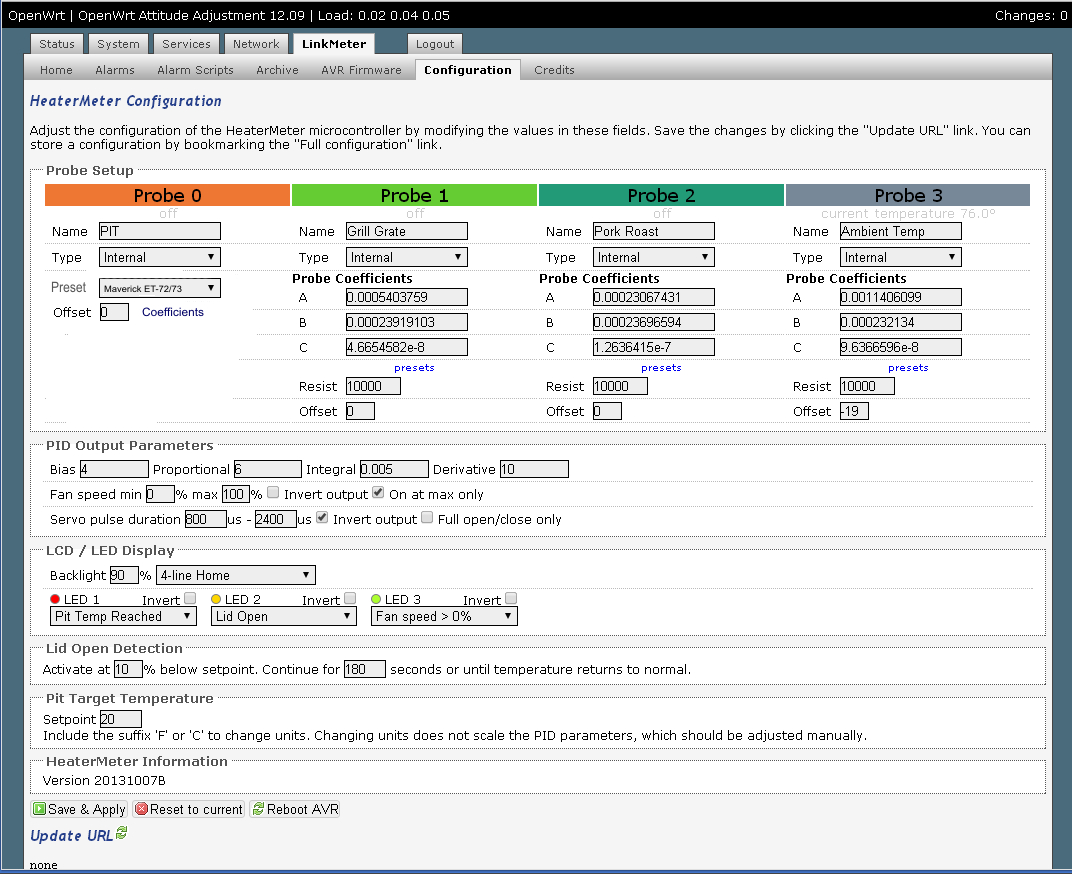
Anticipating the move over to a thermocouple pit probe I think it would be nice to be able to select via software which probe gets used as the pit probe. Reason being, I have several pits and plan on a semi-permanent installation of a thermocouple in only my Kamado grill where I do high heat cooking, my smokers do just fine with the standard probes. I would like to be able to choose which probe controls the pit so I could use either or depending on which grill I am using. (or so if my thermocouple takes a crap I'm not SOL until I get a new one)
I think this one is a pipe dream, but it would be nice to be able to select an area on the bottom graph and delete it, to get rid of yesterdays data or spikes in the data which make the graph scale go really large.
It would also be nice to be able to select the default view time for the graph and have it remembered. Ever since the graph data started to be retained after a power cycle the default auto-scale view likes to select the long time period by default, but most of the time I would prefer to see the 1 hour or 6 hour scale. Every time I load the page or come out of config the graph resets to the long time period and I need to change the display back to the way I like it. Not a biggie, but I do get tired of doing it...
Finally, I don't know if this is possible, but it would be nice if when you select a manual fan speed via software, instead of entering -50 for 50% you could just enter 50% instead? Perhaps the "-" has some significance and needs to be used here, but I thought I would ask/suggest... Also, it would be nice if the setpoint display would show the manual speed setting when running in manual fan mode rather than the irrelevant target temperature.
So I guess that is all software stuff, since you seem to have nailed down the hardware wish list pretty good already...
You've covered lots of bases already, lowering the noise level and adding the filters to the probe line(s) should be a nice improvement, and the integration of thermocouple support is awesome as well. The addition of the servo booster circuit is great, my servo has been working really nice and solid since I put the prototype circuit inline.
One thing I would like to see change, on the graph I think it would be better to have the temperatures listed on the right and the blower speed listed on the left. We had discussed this before and most people agreed, it would be more functional to have the temperature scale on the right where the probe graphs terminate.
Anticipating the move over to a thermocouple pit probe I think it would be nice to be able to select via software which probe gets used as the pit probe. Reason being, I have several pits and plan on a semi-permanent installation of a thermocouple in only my Kamado grill where I do high heat cooking, my smokers do just fine with the standard probes. I would like to be able to choose which probe controls the pit so I could use either or depending on which grill I am using. (or so if my thermocouple takes a crap I'm not SOL until I get a new one)
I think this one is a pipe dream, but it would be nice to be able to select an area on the bottom graph and delete it, to get rid of yesterdays data or spikes in the data which make the graph scale go really large.
It would also be nice to be able to select the default view time for the graph and have it remembered. Ever since the graph data started to be retained after a power cycle the default auto-scale view likes to select the long time period by default, but most of the time I would prefer to see the 1 hour or 6 hour scale. Every time I load the page or come out of config the graph resets to the long time period and I need to change the display back to the way I like it. Not a biggie, but I do get tired of doing it...
Finally, I don't know if this is possible, but it would be nice if when you select a manual fan speed via software, instead of entering -50 for 50% you could just enter 50% instead? Perhaps the "-" has some significance and needs to be used here, but I thought I would ask/suggest... Also, it would be nice if the setpoint display would show the manual speed setting when running in manual fan mode rather than the irrelevant target temperature.
So I guess that is all software stuff, since you seem to have nailed down the hardware wish list pretty good already...
Last edited: