Here is my custom map made by reading the ADC values in octoprint and using an IR thermometer to get actual temps. Not completely accurate, but the best I have
// Updated thermistor table for Amazon thermistors
const temp_entry_t temptable_16[] PROGMEM = {
{ OV(11), 190 },
{ OV(12), 185 },
{ OV(13), 180 },
{ OV(14), 175 },
{ OV(15), 170 },
{ OV(16), 165 },
{ OV(17), 160 },
{ OV(18), 155 },
{ OV(19), 150 },
{ OV(19), 145 },
{ OV(24), 140 },
{ OV(28), 135 },
{ OV(36), 130 },
{ OV(49), 125 },
{ OV(58), 120 },
{ OV(66), 115 },
{ OV(74), 110 },
{ OV(80), 105 },
{ OV(126), 100 },
{ OV(147), 95 },
{ OV(153), 90 },
{ OV(187), 85 },
{ OV(230), 80 },
{ OV(337), 75 },
{ OV(307), 70 },
{ OV(369), 65 },
{ OV(435), 60 },
{ OV(553), 55 },
{ OV(633), 50 },
{ OV(712), 45 },
{ OV(784), 40 },
{ OV(846), 35 },
{ OV(896), 30 },
// { OV(810), 25 },
{ OV(978), 23 },//,
// { OV(988), 15 },
{ OV(994), 10 } //?
// { OV(1000), 5 },
// { OV(1005), 0 }
};
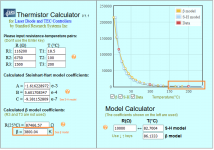
As you can see anything above 145 is extrapolated just to get the block to hit 150. There's no way I could get printing temps like this.
In the attached picture, the flat curve explains the problem. I understand thermistors aren't linear in nature, but it would seem this one is more suited to temperatures under 100C. Also, it shows 3800 beta like Bryan said, but, and I may be wrong, there are different betas. I.e. based on 25/50 spread, 25/100 spread etc. I wonder if these aren't a 25/50 and need to be a 25/100 (or something like that)
Is there any way to "adjust" the curve so there is more slope above 150C?