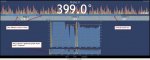
The lower duplicate graph shows a longer amount of time then the main graph. The upper lines correspond with the fan and servo damper outputs based on your setup of what percentage they turn on and ramp up. I think if I remember right. The light more transparent blue PID percentage, dark blue fan speed, and upright line servo open percentage.