Damper Versus Fan


JayC

TVWBB Fan
Yes the graph shows "output" which is the same as "damper percentage". Blower speed is easily identified by knowing that it is scaled linearly. If you say max blower speed 50%, and the output is 50% that means the blower is on 25%. Having them both on the graph is redundant because they have identical curves, just one would be a scaled version of the other. The min speed nothing really understands because it happens internal to the HeaterMeter and isn't output anywhere. It also doesn't matter though because 10% is 10% regardless of if it on 1 second and off for 9 seconds, or on for 2 milliseconds and off for 18 milliseconds. The only thing changed by "min fan speed" is how long the pulse output period is, which users should not burden themselves with.

The little bar above the graph that shows the output actually will display output as well as fan speed (just scaled) in a slightly different color. It isn't very differently colored because adding contrast increases the amount of perceived information, which is already pretty dense.

The blower settings are documented in the "Help" link on the configuration page which leads to Configuration Webui Documentation wiki.


Bryan, I realized that I'm screwing up the other thread so I thought I'd bring there here and start something we can talk about instead.

I'm not sure I understand what you're telling me here. I can't understand how the curve is the same between the two if one is on and one isn't. In other words, if I have the fan set to "on at max only" then the scenario exists where the damper would be opening and closing as much as all the way closed or all the way open but the fan may never actually turn on if the damper has the temperature under control right? Wouldn't that create different output curves between the two?

Now that Ralph posted the code to separate the damper and blower on the UI, I've redlined a picture to help discuss:
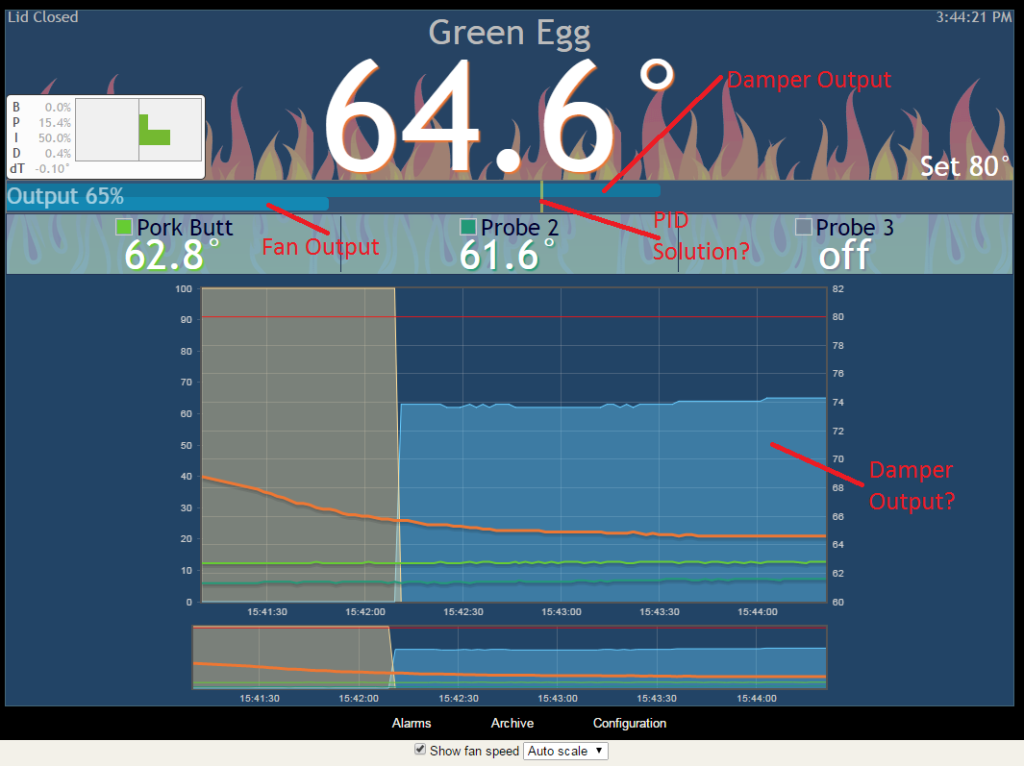
splitscreen_zpsmzjc5qhm.png


The way I understand this is that the top bar shows "how open" the damper is as it's controlling the servo and the bottom bar is showing fan speed in percentage from 0-100. I'm pretty sure that other little line is the solution the the PID equation displayed in real time--I thought that was the damper before seeing the split code that Ralph posted up.

So that means that the chart we're seeing is either:

a) displaying the damper output only
b) displaying the fan output only
c) displaying the combined output of the damper+fan
d) I still have no idea what's going on

I think the right answer here is "a" and it's showing the output of the damper only and the fan isn't being represented at all. Now that's ok, but wouldn't it be valuable to see both the fan and damper in that chart at the same time for slow and low cooks? In other words, if my damper is working properly and the fan isn't turning on at all, that's great to know. But if the fan is having to run a lot while the damper is getting close to being wide open, then that would indicate that the fuel is running low and it's time for a lid open and refuel I'd think?

Or, if I was just watching fan control, that may be valuable too as it assumes that the damper is doing exactly what it is supposed to be doing but if I see the fan start to run up, then again the fuel might be running low. Is that something that can be selected in the with the user CSS coding? Can I display either "a" or "b" or even possibly do them at the same time in different colors?

Ralph, thanks for that piece of code.
 
JayC, I think what you are missing from what Bryan explained is the Blower and Servo are really the SAME as far as the HM control goes... There is not a separate logic for the operation for the servo and blower.... Therefore they are linked together and "the curve is the same", meaning they are responding to the same marching orders...

Where they differ is in the fine tuning for each...

The Servo Pulse Duration sets the limits on how far the servo will travel from 0-100%, and you can set the servo to operate over the entire range or simply be closed when the HM is at 0% or fully open when it is above 0%.

The blower has the Min, Max and Startup max settings to set the lower and upper blower speed limits, and startup blower speed. On at Max only makes the blower only turn on when the HM is at 100%

So the blower and servo respond to the same "decisions" the HM is making about what needs to be happening (more or less air to achieve desired temp), but act on their individual parameters.... If the blower Startup Max is 100% and Max is 50%, the blower will go 100% until the setpoint is achieved and from then on will only be at 50% when the HM (and the Servo) are at 100% (blower at 25% when servo is at 50% etc) So, same curve......

If you use the Servo Open/Close only you could have a scenario where the servo sits fully open most of the time (unless you have over shot the setpoint) and the blower speed is variable, or Fan at Max only the servo operates the full range and the blower only kicks on when the HM hits 100% (fan will run at MAX or Startup Max depending on whether the setpoint has been achieved yet or not)

It seems kinda harder to explain than to understand, just watch whats going on for a while and you will get the hang of it....

I do get what you are saying about the graph, it is basically showing the marching orders from the HM and not directly what the blower and servo were doing at any particular time. You can assume what was happening by knowing how your blower and servo are set to operate, but can't really tell from the graph what is going on for sure. IDK if that extra info is really needed though, the dual blower/servo status bar is enough for me. I guess if you archive cooks the extra info would be useful, so if you run your HM with different configs you can see that on the archive graph... I probably wouldn't use/need that function though....
 
The top bar is the PID output, which is the same as your damper output. The little yellow pip is the moving average of the PID output over I think 5 minutes or something along those lines. The blower output is the bottom bar, which is just PID output * Max Blower / 100 (linear scaled 0-100 = 0-MAX). The graph always shows PID output.

The damper and the blower don't operate independently, they are both the PID output. That's why they're not all on the graph because the shape is always the same, just scaled based on your min and max speed.

I actually misspoke in the other thread too. The bar does show the fan turning on and off with the output is below min (forgot I added that!). It doesn't update every second though so it may not appear to move at all.
 
J
or Fan at Max only the servo operates the full range and the blower only kicks on when the HM hits 100% (fan will run at MAX or Startup Max depending on whether the setpoint has been achieved yet or not)

Ralph, yes! This is what I'm getting at. If in fan at max only mode then really, the output shown in the graph isn't giving you an idea of what happened. Yes, you can sit and watch the double bar you have and know it's ok if you're in front of the computer. You can easily see the output for the servo is essentially what you see on the graph and that the fan is off most of the time if not always but you don't know what happened when you weren't watching.

I'm not sure how useful having both would be either but I tend to think I'd rather just see what the fan was doing than the damper. Or to put it another way, my damper is doing what it does but if the fan kicks in all the sudden when it's been fairly idle because the damper had it under control, I'd know that for sure something was up. Either some holes got plugged in the grates, running out of fuel, wind changed, etc. right?
 
That's probably why you're seeing the fan bar at 50% of the servo bar.

Right, I set it that way just to get a snapshot. But if I had it set to 50% AND "fan at max only" then I might see no bottom bar for the fan and the top bar for the servo could move anywhere from 0-100% open without having the fan kick on at all.
 
Well if the fan option set is "On at max only", then you know when the fan was on, it was on any time the PID output was 100% and what was the fan speed? MAX. You know exactly what the blower speed is when you look at the graph, even without the instantaneous output bars.
 
The top bar is the PID output, which is the same as your damper output. The little yellow pip is the moving average of the PID output over I think 5 minutes or something along those lines. The blower output is the bottom bar, which is just PID output * Max Blower / 100 (linear scaled 0-100 = 0-MAX). The graph always shows PID output.

The damper and the blower don't operate independently, they are both the PID output. That's why they're not all on the graph because the shape is always the same, just scaled based on your min and max speed.

I actually misspoke in the other thread too. The bar does show the fan turning on and off with the output is below min (forgot I added that!). It doesn't update every second though so it may not appear to move at all.

Ok, that makes more sense to me then, Bryan. So the answer was "D";)
 
Well if the fan option set is "On at max only", then you know when the fan was on, it was on any time the PID output was 100% and what was the fan speed? MAX. You know exactly what the blower speed is when you look at the graph, even without the instantaneous output bars.

Facepalm. Ok. I get it now. Now I see where Ralph was with that other option that he was talking about with ramping the fan. I'm not saying that I think it's a needed feature or not, but I get where he's coming from. I need to go back and re-read that.


Back
Top